Hi folks today i will be writing about twitter streaming data to analyse , visualization and trends. Its always a good way of showing the analysis using graphs and pictures. We will be searching for few keywords and see what is happening around the word using those words.
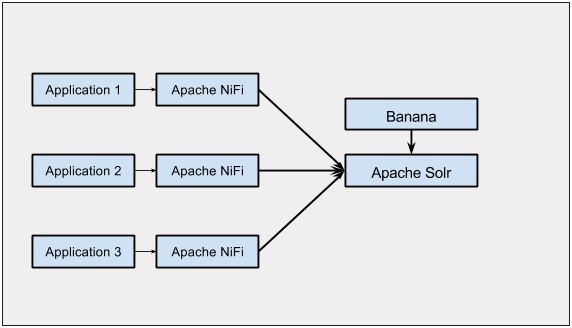
Architecture would be like this
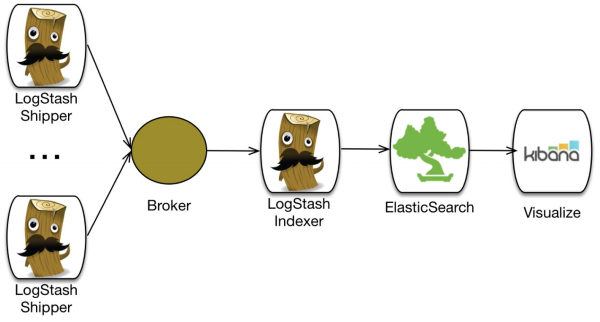
Requirements:- Elasticsearch , Logstash and Kibana.
Elasticsearch:- It is a search server based on Lucene. It provides a distributed, multitenant-capable full-text search engine with an HTTP web interface and schema-free JSON documents. Elasticsearch is developed in Java and is released as open source under the terms of the Apache License. Elasticsearch is the most popular enterprise search engine followed by Apache Solr, also based on Lucene.
Download link:- https://www.elastic.co/downloads/elasticsearch
Logstash:-Its is nothing but log collector as its name says , we will be using this to connect to twitter api and get the tweets as a streams and pass it to elasticsearch so that we can have created index on it.
Download link:- https://www.elastic.co/downloads/logstash
Kibana :- Kibana is an open source data visualization plugin for Elasticsearch. It provides visualization capabilities on top of the content indexed on an Elasticsearch cluster. Users can create bar, line and scatter plots, or pie charts and maps on top of large volumes of data.
Download link:- https://www.elastic.co/downloads/kibana
JAVA 7 :- Its is required for Logstash, which is used for log aggregation and push logs into elasticsearch.
Installation of tools
Elasticsearch:- After downloading the elasticsearch, all you need to do is untar the tar file and move it to /usr/local/elasticsearch .
tar -xzvf elasticsearch-2.1.1.tar.gz
mv elasticsearch-2.1.1 /usr/local/elasticsearch
Now update its configuration with hostname and other optional configuration.
vi /usr/local/elasticsearch/config/elasticsearch.yml
network.host: hadoop
http.port:9200
Once you update the configuration you can start the service which is pretty simple
./bin/elasticsearch
LogStash :- After downloading the Logstash, all you need to do is untar the tar file and move it to /usr/local/logstash .
tar -xzvf logstash-2.1.1.tar.gz
mv logstash-2.1.1 /usr/local/logstash
Now update its configuration with Twitter configuration in new configuration file.
vi /usr/local/logstash/twitter.conf
input {
twitter {
consumer_key => “N8pQIcG8AL8EQAIlM6gp5FuPM”
consumer_secret => “80YiYhQqAZ8QJugta9rBWLwS1RGfSzL5”
oauth_token => “106324-I3gt8IiRYfUK6CTurdWprr60XUaqRLth8fd”
oauth_token_secret => “nMEy2T0w0zKsaLdOhgKvbJJUBDvXpTn9dE1F”
keywords => [ “cricket” ]
full_tweet => true
}
}
filter {
}
output {
stdout {}
elasticsearch {
hosts => “hadoop”
index => “twitter”
document_type => “tweet”
template => “template.json”
template_name => “twitter”
}
}
Create a template.json as well which is actually used for output of twitter in json format.
vi /usr/local/logstash/template.json
{
“template”: “twitter”,
“order”: 1,
“settings”: {
“number_of_shards”: 1
},
“mappings”: {
“tweet”: {
“_all”: {
“enabled”: false
},
“dynamic_templates” : [ {
“message_field” : {
“match” : “message”,
“match_mapping_type” : “string”,
“mapping” : {
“type” : “string”, “index” : “analyzed”, “omit_norms” : true
}
}
}, {
“string_fields” : {
“match” : “*”,
“match_mapping_type” : “string”,
“mapping” : {
“type” : “string”, “index” : “analyzed”, “omit_norms” : true,
“fields” : {
“raw” : {“type”: “string”, “index” : “not_analyzed”, “ignore_above” : 256}
}
}
}
} ],
“properties”: {
“text”: {
“type”: “string”
},
“coordinates”: {
“properties”: {
“coordinates”: {
“type”: “geo_point”
},
“type”: {
“type”: “string”
}
}
}
}
}
}
}
Once you update the configuration you can start the service which is pretty simple
./bin/logstash -f twitter.conf
After starting logstash and elasticsearch you will see that logstash is started generating the messages and elasticsearch is starting updating tweets. Now lets go for kibana for visualization.
Kibana:- After downloading the kibana you need to do the same stuff which you have done for logstash and elasticsearch , untar it and update the configuration.
tar -xzvf kibana-4.3.1-linux-x64.tar.gz
mv kibana-4.3.1 /usr/local/kibana
Update the configuration file kibana.yaml
vi /usr/local/kibana.yaml
server.host: “hadoop” // hostname
elasticsearch.url: “http://hadoop:9200” //elasticsearch hostname and port
Once you update these just start the process
./bin/kibana
Now after starting process open the web url http://hadoop:5601 . 5601 is default port for kibana and you will see web page like below.
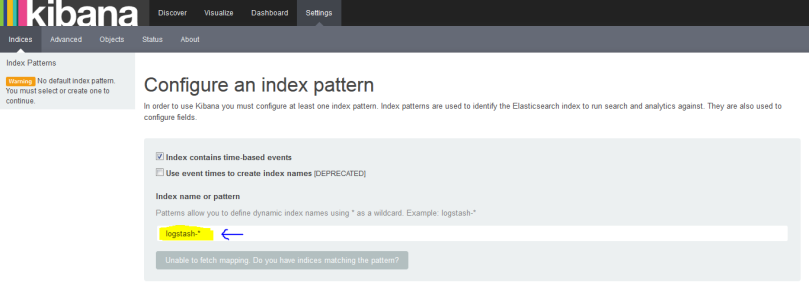
At that yellow colour place you need to provide the index which you used in kibana for indexing. you can put the same name which we have provided in logstash configuration file “twitter“. Once you select this you will see a another time-field name you need to select “@timestamp” like below.
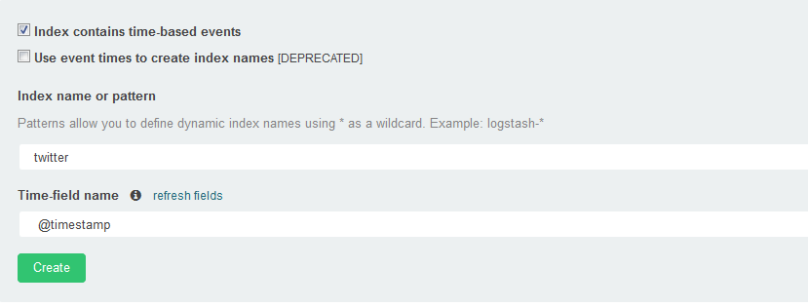
Now click on create and you can make it as default index as well by clicking on * button on same page .
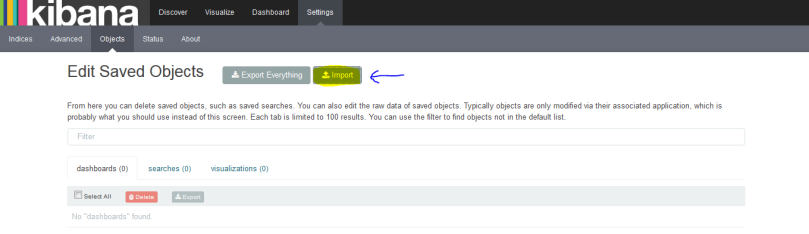
Now on same page click on object tab and import the twitter dashboard which i have created as sample.
Now Upload the below json as dashboard Twitter-templete.json.
[
{
“_id”: “Twitter-Dashboard”,
“_type”: “dashboard”,
“_source”: {
“title”: “Sample Twitter Dashboard”,
“hits”: 0,
“description”: “”,
“panelsJSON”: “[{\”col\”:1,\”id\”:\”Total-Tweets\”,\”row\”:4,\”size_x\”:4,\”size_y\”:2,\”type\”:\”visualization\”},{\”col\”:1,\”id\”:\”Twitter-Dashboard\”,\”row\”:1,\”size_x\”:4,\”size_y\”:3,\”type\”:\”visualization\”},{\”col\”:5,\”id\”:\”Tweets-vs.-time\”,\”row\”:1,\”size_x\”:8,\”size_y\”:5,\”type\”:\”visualization\”},{\”col\”:1,\”id\”:\”Top-10-hashtags\”,\”row\”:6,\”size_x\”:6,\”size_y\”:4,\”type\”:\”visualization\”},{\”col\”:7,\”id\”:\”Top-10-influencers-(by-retweet-volume)\”,\”row\”:6,\”size_x\”:6,\”size_y\”:4,\”type\”:\”visualization\”}]”,
“version”: 1,
“timeRestore”: true,
“timeTo”: “now”,
“timeFrom”: “now-15m”,
“kibanaSavedObjectMeta”: {
“searchSourceJSON”: “{\”filter\”:[{\”query\”:{\”query_string\”:{\”analyze_wildcard\”:true,\”query\”:\”*\”}}}]}”
}
}
},
{
“_id”: “Tweets-vs.-time”,
“_type”: “visualization”,
“_source”: {
“title”: “Tweets vs. time”,
“visState”: “{\”type\”:\”histogram\”,\”params\”:{\”shareYAxis\”:true,\”addTooltip\”:true,\”addLegend\”:true,\”scale\”:\”linear\”,\”mode\”:\”stacked\”,\”times\”:[],\”addTimeMarker\”:false,\”defaultYExtents\”:false,\”setYExtents\”:false,\”yAxis\”:{}},\”aggs\”:[{\”id\”:\”1\”,\”type\”:\”count\”,\”schema\”:\”metric\”,\”params\”:{}},{\”id\”:\”2\”,\”type\”:\”date_histogram\”,\”schema\”:\”segment\”,\”params\”:{\”field\”:\”@timestamp\”,\”interval\”:\”auto\”,\”customInterval\”:\”2h\”,\”min_doc_count\”:1,\”extended_bounds\”:{}}}],\”listeners\”:{}}”,
“description”: “”,
“version”: 1,
“kibanaSavedObjectMeta”: {
“searchSourceJSON”: “{\”index\”:\”twitter\”,\”query\”:{\”query_string\”:{\”query\”:\”*\”,\”analyze_wildcard\”:true}},\”filter\”:[]}”
}
}
},
{
“_id”: “Total-Tweets”,
“_type”: “visualization”,
“_source”: {
“title”: “Total Tweets”,
“visState”: “{\”aggs\”:[{\”id\”:\”1\”,\”params\”:{},\”schema\”:\”metric\”,\”type\”:\”count\”}],\”listeners\”:{},\”params\”:{\”fontSize\”:60},\”type\”:\”metric\”}”,
“description”: “”,
“version”: 1,
“kibanaSavedObjectMeta”: {
“searchSourceJSON”: “{\”index\”:\”twitter\”,\”query\”:{\”query_string\”:{\”query\”:\”*\”,\”analyze_wildcard\”:true}},\”filter\”:[]}”
}
}
},
{
“_id”: “Top-10-hashtags”,
“_type”: “visualization”,
“_source”: {
“title”: “Top 10 hashtags”,
“visState”: “{\”type\”:\”histogram\”,\”params\”:{\”shareYAxis\”:true,\”addTooltip\”:true,\”addLegend\”:true,\”scale\”:\”linear\”,\”mode\”:\”stacked\”,\”times\”:[],\”addTimeMarker\”:false,\”defaultYExtents\”:false,\”setYExtents\”:false,\”yAxis\”:{}},\”aggs\”:[{\”id\”:\”1\”,\”type\”:\”count\”,\”schema\”:\”metric\”,\”params\”:{}},{\”id\”:\”2\”,\”type\”:\”terms\”,\”schema\”:\”segment\”,\”params\”:{\”field\”:\”entities.hashtags.text\”,\”size\”:10,\”order\”:\”desc\”,\”orderBy\”:\”1\”}}],\”listeners\”:{}}”,
“description”: “”,
“version”: 1,
“kibanaSavedObjectMeta”: {
“searchSourceJSON”: “{\”index\”:\”twitter\”,\”query\”:{\”query_string\”:{\”query\”:\”*\”,\”analyze_wildcard\”:true}},\”filter\”:[]}”
}
}
},
{
“_id”: “Top-10-influencers-(by-retweet-volume)”,
“_type”: “visualization”,
“_source”: {
“title”: “Top 10 influencers (by retweet volume)”,
“visState”: “{\”type\”:\”table\”,\”params\”:{\”perPage\”:10,\”showMeticsAtAllLevels\”:false,\”showPartialRows\”:false},\”aggs\”:[{\”id\”:\”1\”,\”type\”:\”max\”,\”schema\”:\”metric\”,\”params\”:{\”field\”:\”retweeted_status.favorite_count\”}},{\”id\”:\”2\”,\”type\”:\”terms\”,\”schema\”:\”bucket\”,\”params\”:{\”field\”:\”retweeted_status.user.screen_name\”,\”size\”:100,\”order\”:\”desc\”,\”orderBy\”:\”1\”}}],\”listeners\”:{}}”,
“description”: “”,
“version”: 1,
“kibanaSavedObjectMeta”: {
“searchSourceJSON”: “{\”index\”:\”twitter\”,\”query\”:{\”query_string\”:{\”analyze_wildcard\”:true,\”query\”:\”*\”}},\”filter\”:[]}”
}
}
},
{
“_id”: “Twitter-Dashboard”,
“_type”: “visualization”,
“_source”: {
“title”: “Twitter Dashboard”,
“visState”: “{\”type\”:\”markdown\”,\”params\”:{\”markdown\”:\”### Sample Dashboard for Twitter stream\\nSimple dashboard for exploring & visualizing tweets tracking a topics of interest. Create new visualizations, customize the dashboard, find new insights.\\n\\n**Happy exploration!!!**\”},\”aggs\”:[],\”listeners\”:{}}”,
“description”: “”,
“version”: 1,
“kibanaSavedObjectMeta”: {
“searchSourceJSON”: “{\”query\”:{\”query_string\”:{\”query\”:\”*\”,\”analyze_wildcard\”:true}},\”filter\”:[]}”
}
}
}
]
Once you save it on you desktop and import it into kibana objects you can see the below image. click on Open sign and you will see a drop down and select the Sample twitter dasboard.

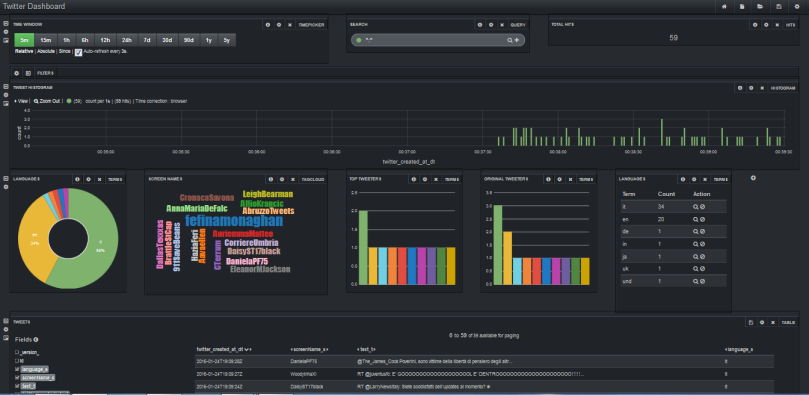
After clicking on Twitter Dashboard, You will See the graphs like below.
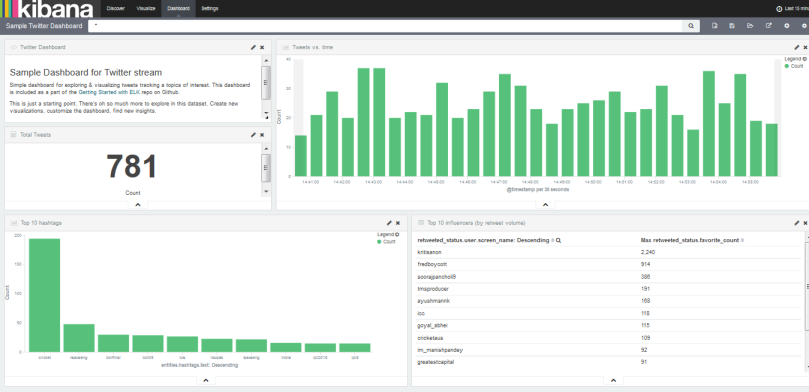
You can create your own new dashboards and add into it. Hope you like this blog.